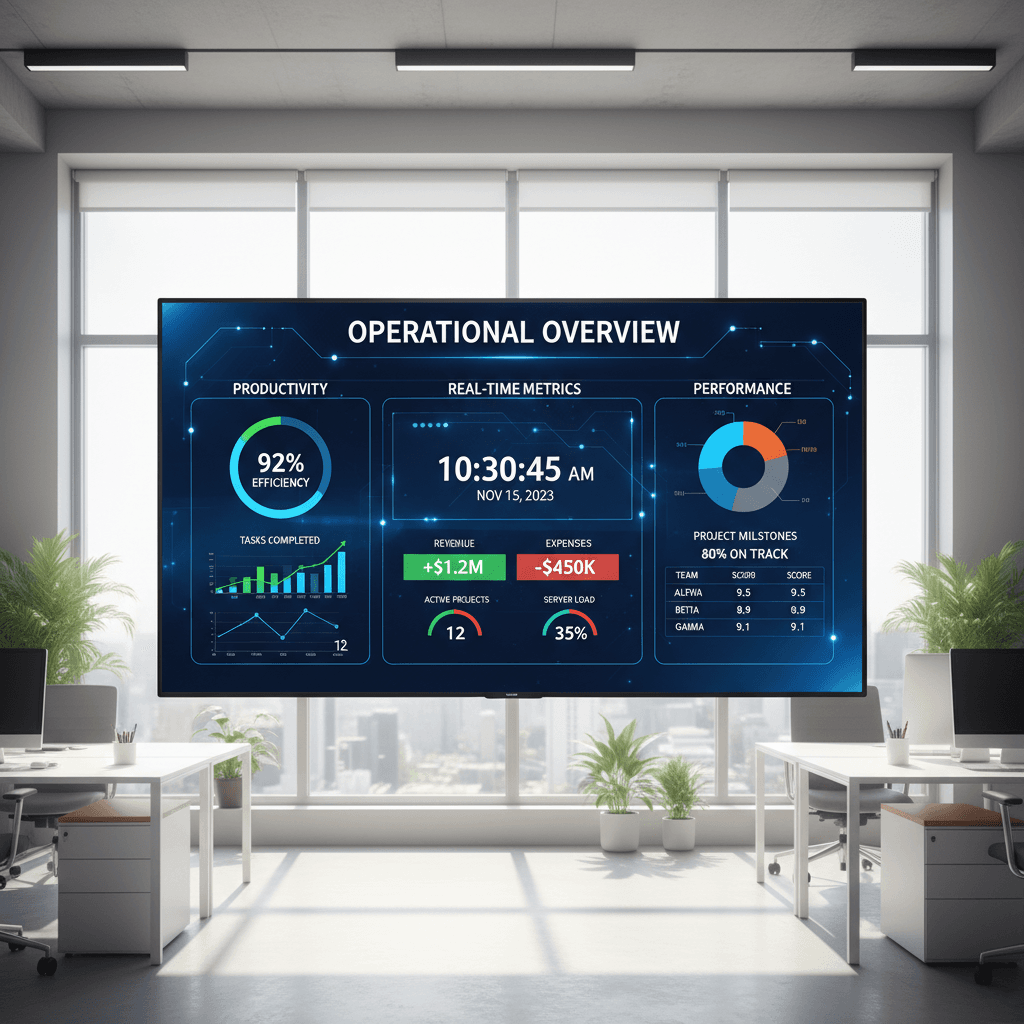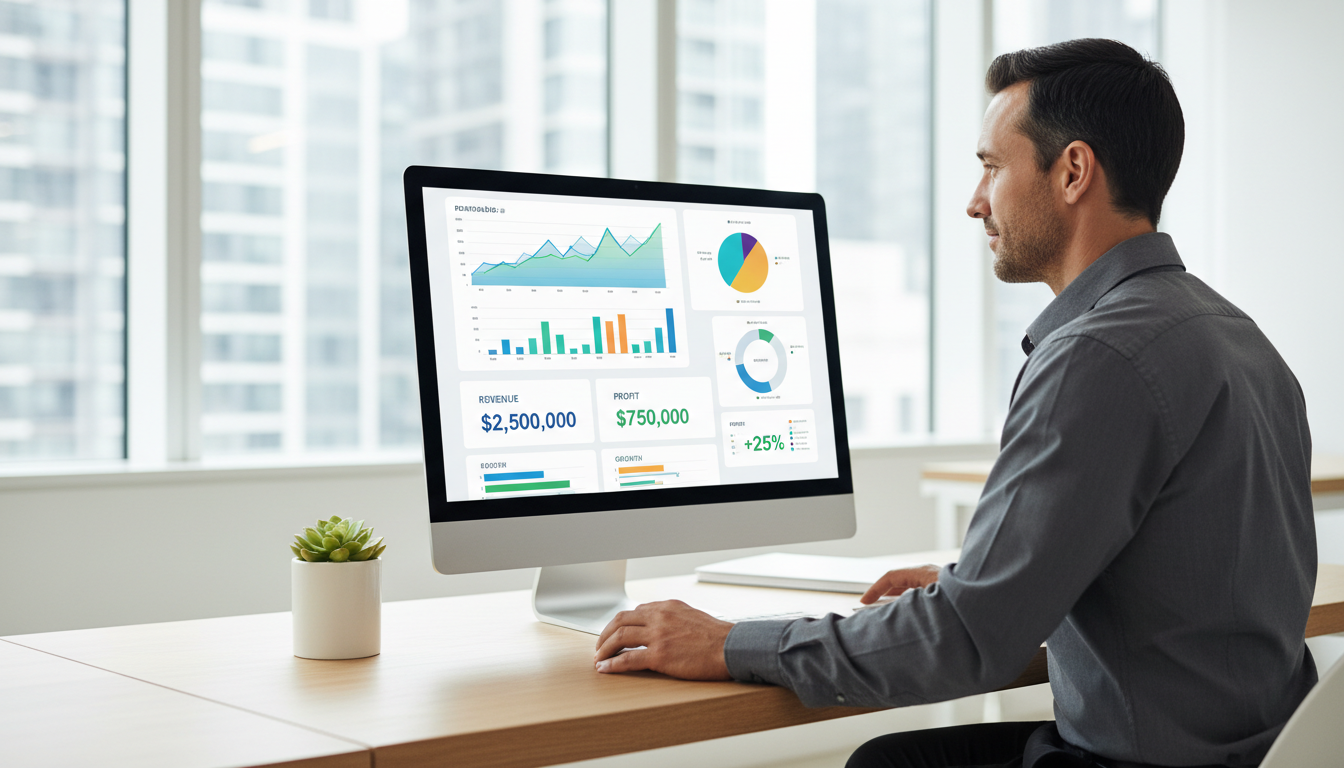
A small business cash flow early warning signs dashboard identifies financial instability by monitoring critical metrics like increasing accounts receivable days, declining cash balances, and a growing reliance on credit. By visualizing these indicators alongside future projections; business owners can spot potential liquidity crises early and implement corrective strategies before they impact operations.
Many business owners look at their bank balance and see profit on the P&L, but they still struggle to meet payroll on Friday. This disconnect creates a constant state of low-level anxiety that hinders strategic growth. Cash flow issues rarely happen overnight; they are the result of subtle, cumulative shifts in accounts receivable, inventory turnover, or overhead creep. Ignoring these micro-trends until they become a crisis is a risk no professional firm can afford to take. In this guide, we will explore how to transition from reactive management to proactive oversight. You will learn the specific red flags that signal impending liquidity gaps and how to construct an automated early warning dashboard. We will also discuss why manual forecasting fails Ontario businesses and how AI provides the predictive edge needed to maintain a healthy cash reserve.
Why Small Businesses Fail Despite Being Profitable
Recent data indicates that 82 percent of small business failures stem from poor cash flow management. This reality exposes a critical distinction that every Ontario business owner must master; the difference between paper profit and liquid cash. A firm can be technically profitable according to its accountant while simultaneously facing insolvency due to the timing of inflows and outflows.
Consider a mid-sized consulting firm in Toronto with a full book of business. Despite high demand, the firm might struggle to meet payroll because its talent costs are due bi-weekly, while its clients adhere to 60-day payment terms. Without a clear view of these timing mismatches, streamlining operations becomes impossible, as management is constantly distracted by immediate liquidity crises. This is where the limitations of traditional accounting become apparent.
A small business cash flow early warning signs dashboard serves as a smoke detector for your business health. It is not merely a summary of past performance; it is a forward-looking tool designed to identify risks before they manifest. By implementing automated data flows, leaders can move beyond the dangerous practice of managing by bank balance, ensuring they have the visibility required to sustain growth. To see how these systems function in practice, you can book a demo to explore our automation frameworks.
Five Red Flags: Identifying Early Warning Signs of Cash Flow Problems
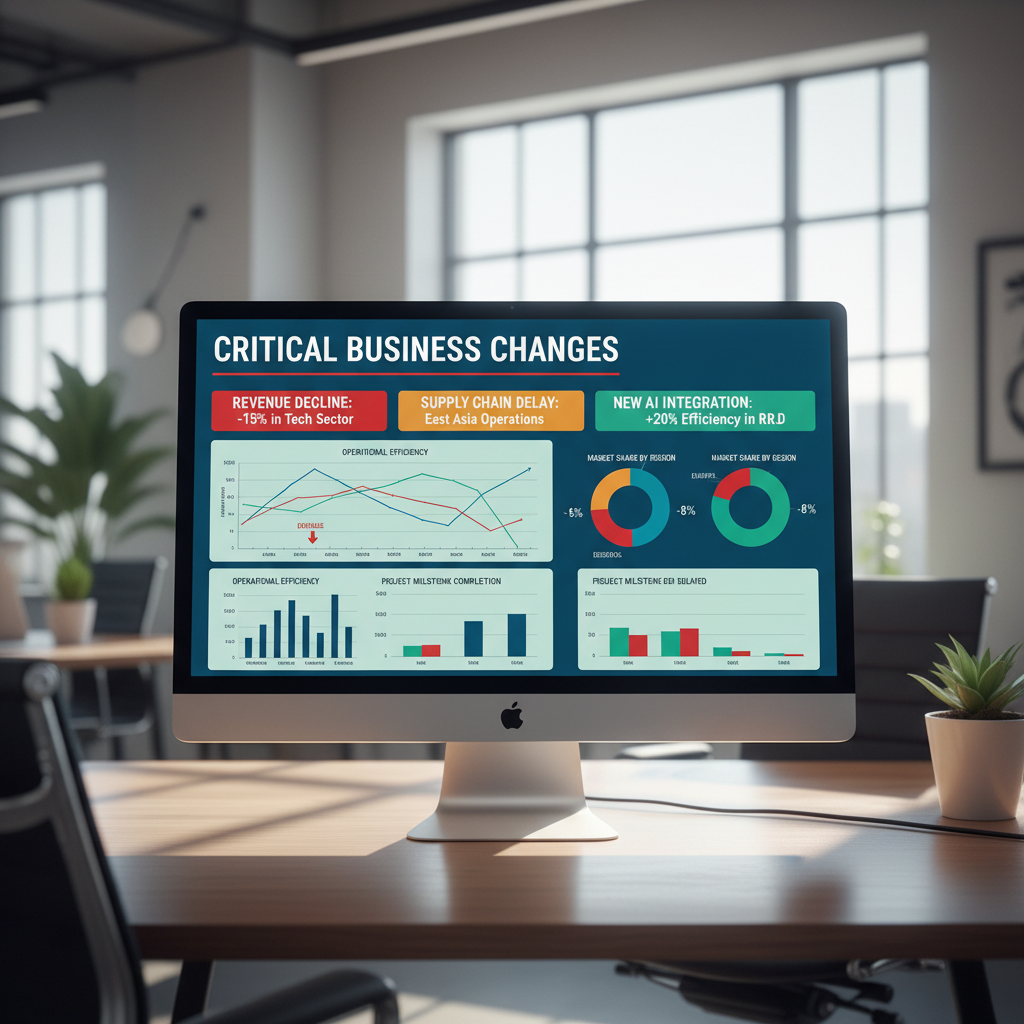
Identifying a crisis requires looking beyond the bottom line of a profit and loss statement. The following five red flags serve as early indicators that a firm is drifting toward a liquidity event, even if the sales pipeline appears healthy.
1. Accounts Receivable (AR) Days Trending Upward When the average time it takes for clients to pay begins to creep upward, cash is being held hostage in your customers' bank accounts. In professional services, a shift from a 30 day to a 45 day average might seem minor; however, for a firm with high overhead, it represents two weeks of missing operational capital. Monitoring this trend through automated data flows ensures you catch payment delays before they become a permanent drag on your growth.
2. Consistent Reliance on Credit Lines for Operations A line of credit should be reserved for strategic growth or major capital expenditures. If you find yourself drawing on credit to cover recurring payroll or vendor obligations, it suggests that your operational inflows are insufficient to sustain your current burn rate. This reliance often masks an underlying business model flaw that interest payments only exacerbate over time.
3. High Customer Concentration Relying on a single client for more than 20 to 25 percent of your revenue creates a fragile ecosystem. If that client experiences their own cash flow issues or delays a single large invoice, your entire operation could stall. A premium dashboard highlights this concentration risk, allowing you to prioritize diversification before a contract is lost or delayed.
4. Margin Erosion Due to Unmonitored COGS For mid-sized firms, profit margins can be quietly hollowed out by rising supplier costs or labor inefficiencies. If your Cost of Goods Sold (COGS) increases while your pricing remains static, your cash buffer shrinks. Without streamlining operations to maintain these margins, you eventually lose the ability to reinvest in the business.
5. Managing by Bank Balance Rather Than Forecast Relying on your current bank balance to make spending decisions is reactive and dangerous. It ignores upcoming hidden outflows such as quarterly HST payments, annual insurance premiums, or scheduled software renewals. A small business cash flow early warning signs dashboard replaces this guesswork with a forward looking view, ensuring you aren't surprised by obligations you could have predicted months in advance. To see how these indicators look in a live environment, you can book a demo of our automated reporting frameworks.
The Anatomy of an Automated Early Warning Signs Dashboard
A premium small business cash flow early warning signs dashboard moves beyond the static, backward-looking nature of traditional accounting reports. While many firms rely on generic Excel templates that require hours of manual data entry, these tools often provide a snapshot that is already outdated by the time the spreadsheet is finalized. Kado Solutions prioritizes automated data flows to ensure that the following four pillars of cash health are monitored in real-time.
Metric | Purpose | Why Automation Matters |
|---|---|---|
13-Week Cash Forecast | Provides a granular view of inflows and outflows for the next quarter. | Manually updating 90 days of variables is prone to error; automated feeds from CRM and ERP ensure accuracy. |
Burn Rate | Measures the speed at which a firm consumes its cash reserves before reaching profitability or needing new capital. | Live feeds capture unexpected spikes in overhead or vendor costs immediately rather than at month-end. |
Days Sales Outstanding (DSO) | Tracks the average number of days it takes to collect payment after a sale has been made. | Integration with invoicing software flags slow-paying clients before they impact payroll. |
Quick Ratio | Evaluates a firm's ability to meet its short-term obligations using its most liquid assets. | Real-time calculation prevents the dangerous "bank balance" management style by factoring in immediate liabilities. |
A dashboard is only as valuable as the integrity of the data it houses. By streamlining operations and replacing manual entry with API connections to your accounting software, the dashboard transforms from a passive report into an active decision-making engine. This shift allows leadership to focus on strategic pivots rather than data reconciliation. Unlike static templates, an automated system accounts for recurring costs and variable revenue streams without requiring a staff member to spend hours in a spreadsheet each week. To understand how these components integrate into your current stack, you can book a demo of our automated reporting frameworks.
How to Build a Cash Flow Early Warning Signs Dashboard for Small Business

Transforming a static spreadsheet into a dynamic decision-making engine requires a disciplined approach to data architecture. To build a robust small business cash flow early warning signs dashboard, firms must move away from manual entry and embrace a system where data moves autonomously. This transition ensures that the leadership team spends their time on strategic pivots rather than data reconciliation.
### Step 1: Establishing the Direct Data Connection Your accounting platform, such as Xero or QuickBooks, holds the raw transactional data, but it is not designed to be a forecasting engine. The first step involves setting up automated data flows that connect your accounting software to a centralized data warehouse or a specialized visualization tool. This infrastructure eliminates the human latency inherent in manual exports. By streaming data in real-time, you ensure that your dashboard reflects today’s actual liquidity, not a summary from the previous month.
### Step 2: Defining Critical Threshold Alerts A dashboard is only an early warning system if it actively signals when a metric enters a danger zone. You must define specific thresholds that reflect your operational reality. For a Toronto consulting firm with high talent costs, a critical alert might be triggered if cash reserves drop below two months of operating expenses. Other essential triggers include a 10 percent increase in Days Sales Outstanding or a spike in vendor payables. These alerts act as automated smoke detectors, giving you the lead time necessary to adjust spending or accelerate collections before the bank balance reaches a critical low.
### Step 3: Layering in Scenario Planning Static forecasts often fail because they assume a linear path. A sophisticated dashboard allows for sensitivity analysis, or scenario planning, where you can model the impact of external shocks. What happens if your largest client delays payment by 30 days? What if your Cost of Goods Sold increases by 15 percent? By streamlining operations through automated modeling, you can toggle between best case and worst case scenarios instantly.
Kado Solutions helps businesses move from backward-looking reporting, which merely catalogs past mistakes, to forward-looking early warning systems. This shift is vital for mid-sized firms that need to scale efficiently without the risk of an unforeseen liquidity event. To see how these automated systems can be integrated into your business, you can book a demo to explore our custom dashboard frameworks.
The Role of AI and Automation in Cash Management
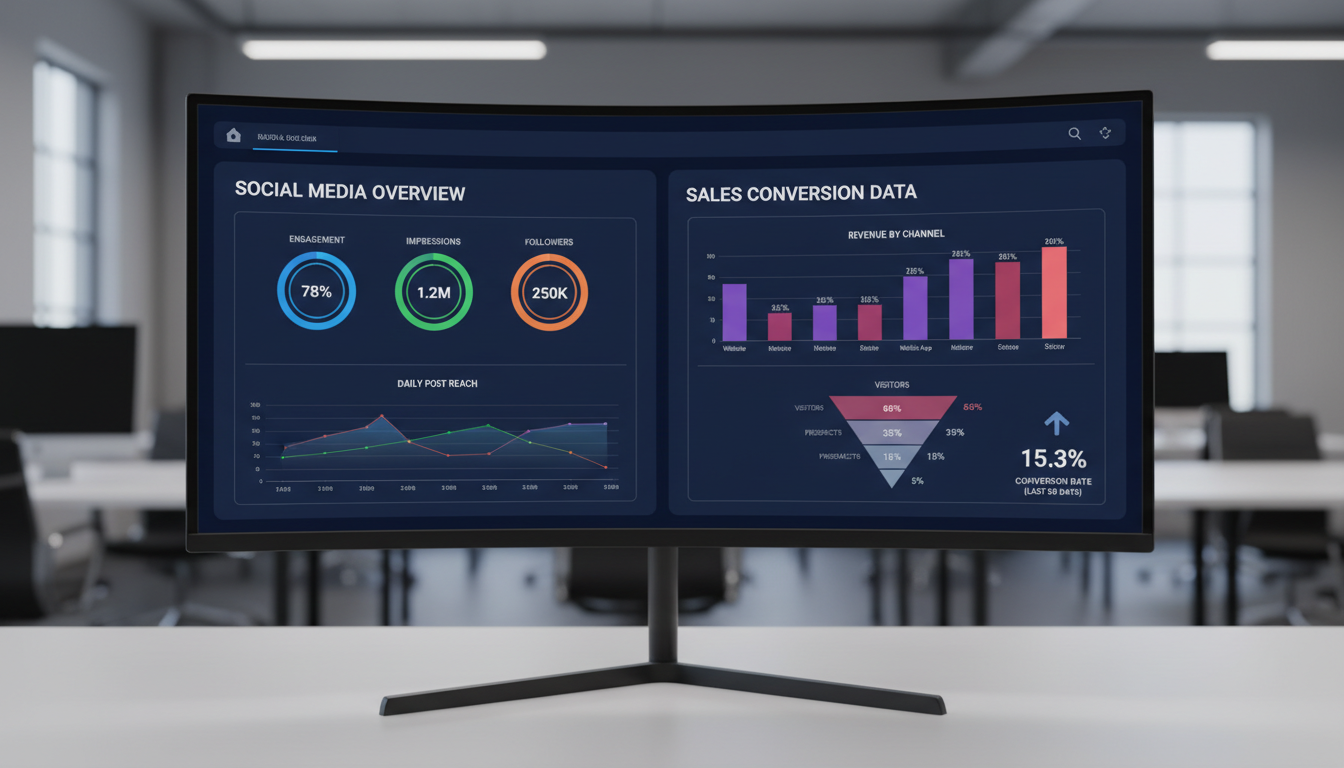
The transition from static monitoring to predictive intelligence is where true operational resilience begins. While a basic small business cash flow early warning signs dashboard tracks what has already happened, AI layers in foresight by analyzing historical customer behavior. For example, AI algorithms can predict when a client will actually settle an invoice versus the date printed on the document. By evaluating past payment trends, the system identifies consistent delays and automatically adjusts your 13-week forecast to reflect realistic liquidity rather than optimistic projections. This level of precision prevents Toronto firms from making critical hiring or investment decisions based on cash that is still weeks away from the bank account.
Reducing manual labor is the primary driver behind streamlining operations in modern finance departments. When reporting is automated, your leadership team stops debating the accuracy of the data and starts discussing the implications of the trends. Kado Solutions leverages automated data flows to eliminate the risk of human error in data entry, ensuring your dashboard remains a reliable source of truth without requiring hours of administrative upkeep.
This technological foundation is most effective when managed by a lean, specialized team. By combining AI automation with dedicated offshore talent, Kado Solutions provides the strategic visibility typically associated with a full-time CFO at a significantly lower price point. This approach ensures your cash management system is maintained, audited, and optimized without the overhead of a senior executive hire. To explore how this hybrid model can secure your firm’s financial future, you can book a demo to see our frameworks in action.
Why Manual Cash Flow Forecasting Fails Ontario Business Owners
Ontario business owners often fall into the trap of the monthly update. If you only review your liquidity every thirty days, you are already too late to respond to a crisis. For a Toronto consulting firm, a significant payment delay on the first of the month remains invisible until the month end report is finalized, creating a dangerous visibility gap. Manual spreadsheets are notorious for human error and data entry fatigue, often providing stale information by the time the file is saved.
Scaling a mid-sized business requires a small business cash flow early warning signs dashboard that prioritizes real-time signals over historic summaries. By implementing automated data flows and streamlining operations, leaders replace backward looking guesswork with actionable foresight. To see how automation eliminates manual reporting lag, you can book a demo of our forecasting frameworks.
Monitoring your cash flow trends through a dedicated dashboard is the most effective way to protect your company from unexpected financial shifts. By spotting these early warning signs, you gain the time needed to adjust your strategy and maintain lasting stability. If you want expert help building a system that provides this level of clarity, you can read more About Kado Solutions and our approach to financial health. We specialize in turning complex data into actionable insights, ensuring you always feel prepared for the future.