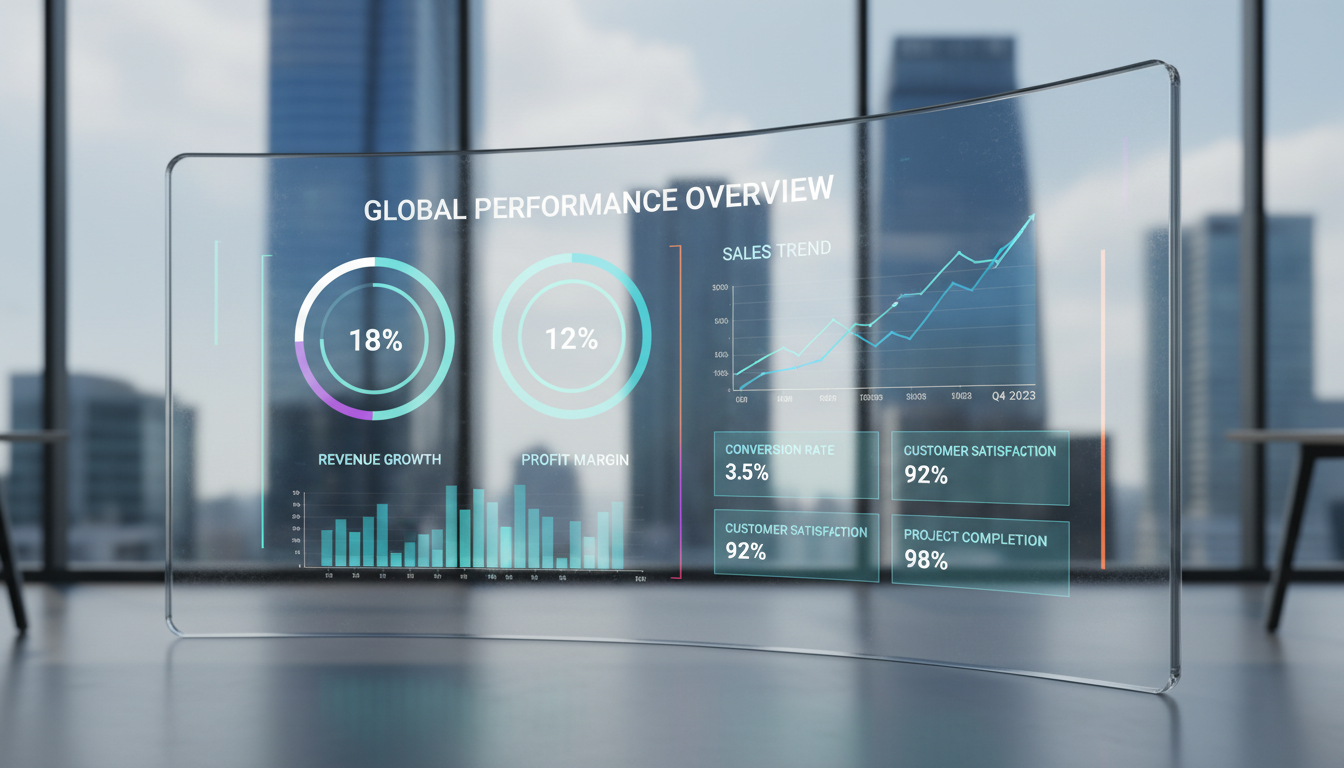
An agency utilization report measures the efficiency of a firm by calculating the ratio of billable hours to total available capacity. By analyzing this data, agencies can identify critical operational issues such as inaccurate project scoping, staffing imbalances, and time tracking errors. Maintaining a healthy utilization rate, typically between 70 and 80 percent, ensures that the business remains profitable while avoiding employee burnout.
Most agency leaders view the utilization report as a simple tally of billable hours versus capacity. However, if your team feels overworked yet profit margins remain stagnant, a surface level glance at the numbers is not enough. This disconnect usually stems from deeper operational inefficiencies that traditional spreadsheets fail to capture. To truly optimize your firm, you must treat your utilization data as a diagnostic lens rather than a static result. In this guide, we will move beyond the basic math to identify specific gaps in your business. You will learn how to distinguish between poor time tracking habits, recurring scoping errors, and genuine staffing shortages. By the end, you will have a clear framework to automate these insights and transform your raw data into a strategic roadmap for growth.
Why an Agency Utilization Report is More Than Just a Math Equation
For any professional services firm, the agency utilization report is the primary metric for measuring health and profitability. At its simplest, the calculation is straightforward: divide total billable hours by total available capacity. However, treating this report as a mere math equation overlooks its true function as a diagnostic tool. While a spreadsheet might tell you a team member is at 50 percent, it does not explain the cause. That number is rarely the problem itself; it is a symptom of underlying operational friction.
To use this data effectively, you must differentiate between total utilization, which includes all productive work like training and internal meetings, and billable utilization, which focuses exclusively on revenue generating hours. In highly competitive markets like Toronto and across North America, firms that fail to make this distinction often struggle to scale. They may see high activity levels but flat profit margins. Research indicates that only 58 percent of agencies actively track these metrics, leaving nearly half the industry flying blind regarding their most expensive asset: time.
When you streamline operations with AI automation, the utilization report shifts from a historical record to a real-time warning system. A bad number acts as the first indicator that something is misaligned in your workflow, whether it is a data integrity issue or a fundamental flaw in how projects are scoped. By viewing utilization as a window into your business processes rather than just a KPI, you can begin to identify where manual labor is draining your resources and preventing efficient scaling.
Establishing Realistic Benchmarks for Billable Hours and Capacity Planning

To move beyond raw numbers, you must understand what constitutes a healthy agency utilization report within your specific sector. Benchmarks are not universal; they fluctuate based on the nature of the deliverables. Research indicates that creative agencies typically aim for 58 to 68 percent billable utilization. In contrast, technical or development firms, which often benefit from more standardized workflows, generally target 72 to 82 percent.
Falling into the 60 percent trap is a common indicator of structural inefficiency. If your agency-wide utilization consistently dips below this 60 percent threshold, you are likely facing a significant margin problem where overhead and non-billable time are cannibalizing your net profits. This often signals that your internal processes require more manual intervention than your pricing can sustain.
Benchmarks also vary significantly by seniority. Senior staff members usually land between 70 to 80 percent because they must reserve time for mentorship, business development, and high-level strategy. Junior staff should ideally maintain higher billable rates, as their primary responsibility is execution. Establishing these baselines is a critical step for automated agency resource planning. Without realistic targets tailored to your firm's specific service model, you cannot accurately diagnose the tracking, scoping, or staffing issues discussed in the following sections.
Diagnostic Phase 1: Identifying a Tracking Problem

If your agency utilization report shows numbers well below the benchmarks discussed, the problem often lies in data integrity rather than a lack of productivity. Before assuming a team is underperforming, you must investigate if they are simply under-reporting. A common sign of a tracking problem is the Friday afternoon scramble, where staff retroactively fill in gaps from memory. This leads to generic entries and missing hours that never make it into the final calculation.
Another red flag is a suspicious spike in non-billable admin time. When employees are unsure where to log their work or feel pressured by unrealistic billable targets, they often dump complex tasks into categories like Internal Admin or General Support. This masks the true nature of their effort and skews the report. You might also notice inconsistent tracking habits across different departments; your technical team might log time to the minute while your creative team logs in vague four-hour blocks. These discrepancies make agency-wide comparisons impossible.
To fix this, you must move away from manual time tracking. Relying on staff to manually input data into spreadsheets or disconnected tools is a form of manual labor that introduces human error. The goal is to streamline operations with AI automation so that time capture becomes a byproduct of the workflow itself, not a separate chore. Eliminating the manual effort required to generate these reports ensures the data is accurate, granular, and timely. If you cannot trust your data, you cannot make informed decisions about hiring or pricing. You can book a demo for agency reporting to see how automated dashboards replace these unreliable manual processes.
Diagnostic Phase 2: Uncovering a Scoping Problem
Once you have established confidence in your data integrity, you may encounter a more deceptive problem: high activity paired with low profitability. It is common to see a team maintaining an 85 percent billable rate while the firm struggles with cash flow. This paradox usually points to a scoping or pricing failure. In this scenario, your agency utilization report shows a team that is technically busy, but they are performing labor that was never properly accounted for in the initial contract.
Consider the 160 percent project scenario identified in industry research. If a project requires 160 hours to complete but was only quoted and billed for 100, your team appears perfectly utilized on paper. In reality, you are losing money on every hour worked beyond the estimate. If your historical utilization for a specific project type consistently exceeds the quote, there is no reason to pursue that deal again without fundamentally adjusting your pricing model. To prevent this, firms must streamline operations with AI automation to compare actual time spent against the original Statement of Work in real time, rather than discovering the loss weeks after the project closes.
To identify if your high utilization is actually a scoping issue, look for these specific indicators within your reports:
Specific roles, such as senior strategists or lead designers, hit 100 percent utilization while project milestones remain stagnant.
A project shows high billable hours, but the realization rate, the actual revenue earned per hour, is significantly lower than your standard hourly rate.
Scope creep is disguised as standard revisions that push total hours far beyond the initial estimate.
Identifying these patterns allows you to refine your automated agency resource planning by building more accurate buffers into future quotes. If the report shows that your local team is consistently over-extended on low-margin tasks, it may be time to reassess how you allocate your human capital.
Diagnostic Phase 3: Solving a Staffing and Capacity Problem

When your data is clean and your scoping is accurate, the agency utilization report reveals the hardest truth; you either have too much work or too few people. This is the capacity ceiling. If your report shows individual or team utilization consistently exceeding 85 percent, you are operating in a danger zone. High billable rates might look good on a monthly P&L, but sustained levels above this threshold lead to burnout, decreased work quality, and eventual turnover. Conversely, if utilization lingers below 50 percent, you are burning payroll on non-billable activity, effectively subsidizing inefficiency.
For firms in Toronto and other high-cost North American markets, the traditional response is a binary choice: hire expensive local talent or initiate layoffs. Kado Solutions offers a more strategic alternative through lean offshore talent. Instead of committing to the high overhead of a full-time local hire to manage temporary spikes, you can deploy a dedicated offshore team to handle the overflow.
Utilization Level | Primary Risk | Strategic Action |
|---|---|---|
> 85% | Burnout and quality degradation | Offload repetitive tasks to offshore support |
70% - 80% | Optimal performance | Monitor for stability and growth opportunities |
< 50% | Payroll leakage | Reassess internal workflows and sales pipeline |
This model allows your senior local staff to focus on high-level strategy and client relationships while offshore resources manage the execution-heavy, repetitive tasks that often drag down utilization. By integrating these teams, you streamline operations with AI automation and human labor in a way that balances the load. This approach stabilizes your agency utilization report, ensuring that your experts are neither overwhelmed by volume nor underutilized due to administrative bloat. To see how this balance looks in practice, you can book a demo for agency reporting and capacity modeling.
How to Automate Your Agency Utilization Reporting Workflow
Most agencies treat their agency utilization report as a monthly post-mortem. By the time a project manager finishes stitching together data from various spreadsheets, the insights are already outdated. To truly streamline operations with AI automation, firms must move beyond manual exports. Kado Solutions specializes in building automated pipelines that connect your primary time-tracking tools, such as Harvest, Scoro, or Toggl, directly to a centralized analytics dashboard. This eliminates the labor intensive process of data cleaning and formatting, ensuring the numbers you see are refreshed daily rather than monthly.
The shift from historical reporting to real-time decision making fundamentally changes how projects are managed. Instead of realizing three weeks too late that a developer is over-capacity or a project is suffering from scope creep, leadership can adjust workflows in the current week. This level of automated agency resource planning allows for proactive course correction. For project managers, this automation reclaims hours previously spent on administrative tasks; time that is better spent on high-level strategy and client satisfaction.
Automation does more than just save time; it ensures objectivity. By removing the human element from data compilation, you eliminate the temptation to smooth out anomalies before they reach senior leadership. A transparent, automated agency utilization report provides the raw truth necessary to scale. If you are ready to replace manual tracking with a dynamic, real-time system, you can book a demo for agency reporting to see how these integrated dashboards function in a live environment.
Understanding your utilization reports is essential for identifying hidden leaks in your agency's efficiency. By focusing on tracking accuracy, realistic scoping, and balanced staffing, you can transform these data points into a clear roadmap for growth. If you find the data overwhelming or want expert help to further optimize your operations, exploring our tailored Services is a natural next step. We can help you turn complex metrics into actionable strategies, allowing you to focus on your core creative work.